NASA's Jet Propulsion Laboratory (JPL) in Southern California has provided a new visualization of the extreme temperatures that plague Phoenix, revealing the intense heat trapped within urban environments.
This detailed heat map, created using data from a NASA instrument aboard the International Space Station, illuminates the hazards of urban heat in one of America's hottest cities.

NASA Maps the Skin-Burning Heat in Phoenix
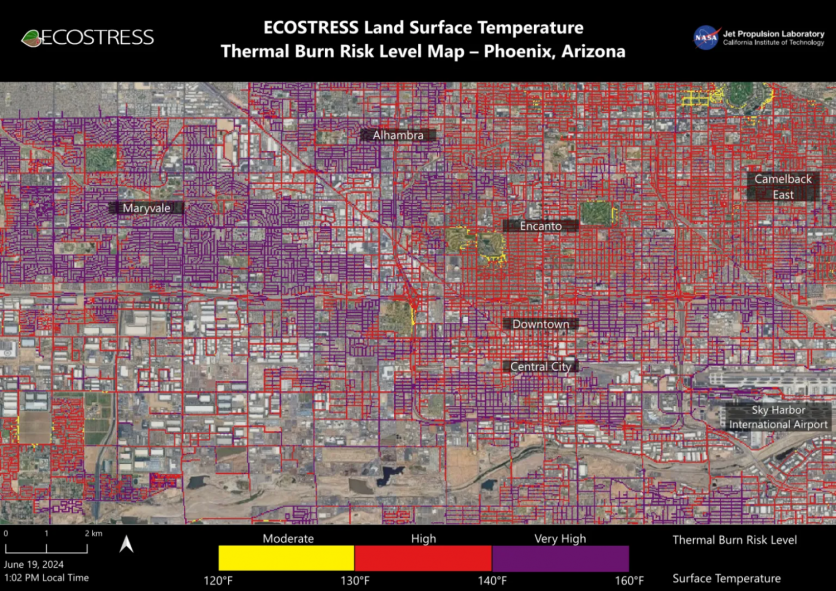
On June 19, at 1:02 p.m. local time, the ECOSTRESS instrument (short for Ecosystem Spaceborne Thermal Radiometer Experiment on Space Station) measured thermal infrared emissions from Earth's surface, focusing on Phoenix.
This heat map demonstrates land surface temperatures across the city's grid of roads and adjacent sidewalks, emphasizing how urban areas can become dangerously hot during summer.
In Phoenix, dark asphalt and concrete surfaces can reach temperatures of at least 120 degrees Fahrenheit (49 degrees Celsius), hot enough to cause serious burns upon skin contact in minutes or even seconds.
The heat map displays these surfaces in yellow, red, and purple, indicating varying degrees of heat. The data reveals how urban environments could turn hazardous under the intense sun, with streets and sidewalks becoming perilous.
The visualization also highlights the cooling effects of green spaces in neighborhoods like Encanto and Camelback East, in contrast to hotter areas such as Maryvale and Central City, which lack sufficient parks and trees.
These cooler areas show the impact of vegetation in mitigating urban heat, providing a stark comparison to more built-up regions. Glynn Hulley, a climate researcher at JPL, noted that creating these maps aims to make data accessible to the public and citizen scientists.
He emphasized that these visualizations are crucial for planning effective heat mitigation strategies, such as tree planting, to reduce the temperature of the hottest urban areas.
Read Also : NASA's Mars Odyssey Robotic Spacecraft Captures Never-Before-Seen View of the Solar System's Tallest Volcano
Extreme Temperature Recorded in the Airport
One of the most extreme temperatures recorded by ECOSTRESS was at Phoenix's Sky Harbor International Airport, where the land surface temperature reached around 140 degrees Fahrenheit (60 degrees Celsius).
On the same day, the air temperature at the airport was recorded at 106 degrees Fahrenheit (43 degrees Celsius). The heat map highlights the significant difference between air temperature, measured out of direct sunlight, and the land surface temperature, which can be much higher.
NASA noted that dark asphalt streets absorb more sunlight than lighter-colored surfaces. This material can take up to 95% of solar radiation, causing the surface to be 40 to 60 degrees Fahrenheit (22 to 33 degrees Celsius) hotter than the air temperature on scorching days.
Scientists employed a machine learning algorithm that generated the image of Phoenix using data from additional satellites, such as NASA/USGS Landsat and Sentinel-2. The combined data enhanced the surface temperature resolution to 100 feet by 100 feet.
Related Article : NASA's Hubble Space Telescope Captures Mesmerizing Image of Sweeping Spiral Galaxy 43 Million Light-Years From Earth

ⓒ 2026 TECHTIMES.com All rights reserved. Do not reproduce without permission.


