
Anyone building cloud applications is familiar with Amazon Web Services. They provide the foundational cloud infrastructure for businesses all around the world. To help ensure reliability and improve understandability, they offer a native monitoring solution - AWS CloudWatch.
While this monitoring service from AWS is powerful (especially if you are only using their cloud), many enterprises need better observability than it can provide. Because of this, they find themselves seeking alternative solutions to augment or replace their CloudWatch monitoring workflows. These companies are often at scale and multi-cloud (and maybe even have some on-prem infrastructure) and find that AWS CloudWatch lacks the contextual depth, multi-cloud integration, cost efficiency, and usability that they need to operate efficiently.
When evaluating CloudWatch alternatives, customers should identify which engineers will use the platform and their key use cases. Across the cloud monitoring market, no single observability tool provides full-stack depth that will be sufficient for all use cases, from troubleshooting, to security audits, to cost and performance optimization. Instead, most solutions specialize in observability around a particular concern or part of the stack, and may provide some additional general observability outside their area of focus.
Datadog - Single Pane of Glass Observability
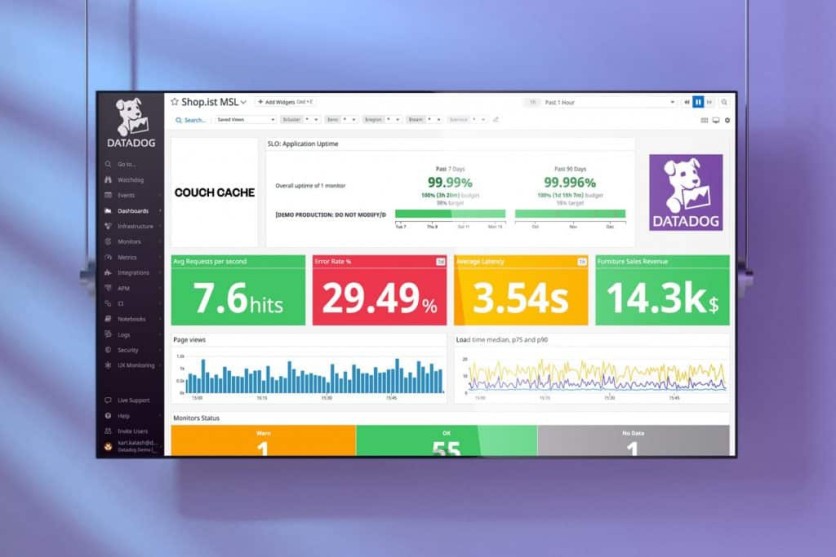
Datadog is one of the most powerful monitoring and observability solutions on the market, highlighted by their large market share and overall dominance in the world of DevOps SaaS. Perhaps they are one of the more expensive options for observability, but no other tool expands across so many domains successfully - from infrastructure to application to log management and even security.
One of the main limitations of AWS Cloudwatch is the most obvious: it only works on AWS. Many enterprise companies have multi-cloud workloads and there's an obvious desire (and even need) to have a centralized NOC where all systems can be viewed and monitored in one place. Add onto that some native alerting and anomaly detection and there's a reason why Datadog has become a standard solution for many DevOps-based teams.
Grafana - DIY Observability
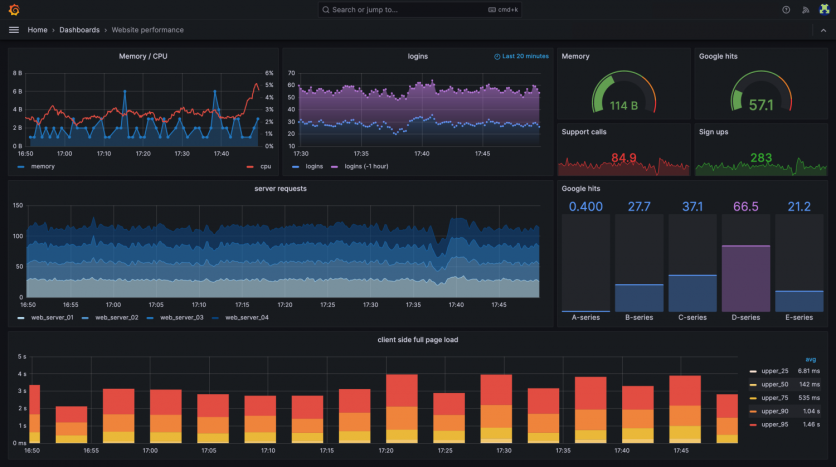
If you love open source and getting your hands dirty - Grafana may be the option for you. Unlike Datadog, which is a more off-the-shelf solution, Grafana provides end users with endless customization options. Users of Grafana can collect, correlate, and visualize data with beautiful dashboards via their open source visualization and monitoring solution that enhances system performance and streamlines troubleshooting for DevOps and platform teams. The level of granularity and insight you can get into your systems with Grafana is unparalleled and worth it for those willing to spend the extra time and effort.
Kentik - Deep Network Observability

Kentik is a transformative force in network observability. In an era defined by the internet's pervasive influence, the company recognizes the critical importance of real-time visibility into network traffic. Traditional network monitoring tools have struggled to keep up as enterprises deploy more software to hyperscalers and take on the complexity of hybrid and multi-cloud networks. Kentik offers a SaaS solution that grants immediate insight into traffic flows, even across networks not owned by the user.
And Kentik doesn't just stop at visibility; it recognizes the need for business context in infrastructure management. In a digital landscape where efficient network management is synonymous with business success, they provide the tools for thriving in the modern age, offering a path to network excellence and operational efficiency. The company also announced the addition of Journeys AI, which democratizes investigations with AI-assisted workflows for troubleshooting, adding to the machine learning and anomaly detection capabilities of Kentik AI.
Dynatrace - Application-First Observability
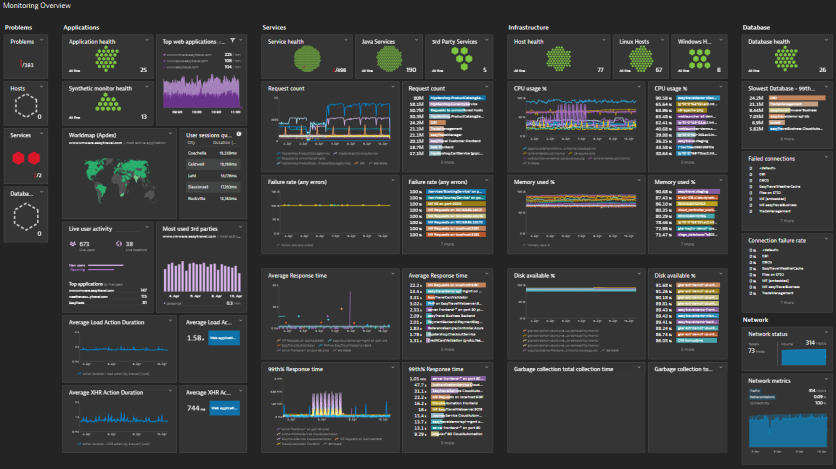
Dynatrace has been a quiet disruptor to Datadog for years and is certainly a more robust alternative to AWS Cloudwatch. The company has made a real appeal to developers - acquiring Rookout last year for their revolutionary non-breaking breakpoints technology. While Dynatrace is a major player that spans infrastructure and applications, and even delves into security, it's core is a deep understand of the application, known in the industry as Application Performance Monitoring (APM). Dynatrace is uniquely situated particularly for developers, who perhaps care more about the performance of their application than the health of the underlying cloud infrastructure.
All of these tools are great and it's worth noting that many enterprises use multiple tools and solutions based on team preference and specific use case. If you are a heavy AWS user, you likely won't abandon AWS Cloudwatch entirely - but you may feed that native data into a 3rd party tool like Datadog so you have the bigger picture in front of you with the relevant systems and business context. Or you may choose Kentik if you are a network engineer, or Grafana if you are an open source advocate that loves to tinker.
ⓒ 2026 TECHTIMES.com All rights reserved. Do not reproduce without permission.


